 Z. Michael Gehlke
Effective Semantics: Shape Types as Digital Images
Abstract
This paper will introduce the idea of encoding datatypes as digital images by exploring a particular class: shape types.
Shape types are a common “higher order” type that have an easy geometric interpretation. These shape types are used to encode equivalence structures in logical theories such as homotopy type theory and cubical type theory. At HoTT2019, an open call to improve proof engines emerged – eg, to verify that Brunerie’s number is 2. Indeed, a number of mathematicians such as Peter Scholze have led efforts to formally verify mathematics.
Digital images are a standard computer encoding for efficient computation, with specialized hardware capable of performing tens to hundreds of times faster than standard CPUs. One option to scale-up mathematical reasoning (per challenge above) is to enable the usage of such specialized technology.
We will introduce the topic in three parts:
- introducing the relationship between shape types (eg,
Square) and diagrams, taken from the work on categorical semantics for type theories; - introducing the relationship between diagrams and digital images, which constitues the new work; and,
- working through the example of
Cylinder = Square + Glueencoded in all three ways, to show how to apply this work.
Shape Types to Diagrams
This section will explore the connection between shape types, complexes, and diagrams. We will introduce this concept in layers – starting with the 0-dimension point and extending to the 2-dimension square and cylinder.
This leverages a standard construction for type theory semantics, which interprets the type statement as a shape decorated with data, and then converts those into a diagram of the type construction. It is these construction diagrams which we convert into digital images, later.
0-Dimension
There is only a single geometric type for 0-dimensions, the Point type – which represents a single datum of some type.
Here, we will represent each object three ways: as a typed statement, as a decorated shape, and as a diagram of maps.
| Type | Shape | Diagram |
|---|---|---|
Point(a) |
 |
 |
The point is a 0-dimensional cell as a shape and a single object as a diagram.
1-Dimension
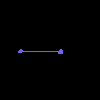
There are two main geometric types for 1-dimension, the Interval and the Loop – with the chief distinction being that the Loop is an Interval where 0=1.
| Type | Shape | Diagram |
|---|---|---|
Interval(a, b) |
 |
 |
Loop(a, b, a=b) |
 |
 |
Each of these consists of two points and one 1-dimensional cell, glued appropriately. The difference between the loop and the interval is the identific ation of the two endpoints.
Here the diagrams have a color-coding: purple represents equality, pink represents inclusion, and blue represents restriction. This helps distinguish the types of arrows in the diagram, particularly when looking at their digital image encoding. We maintain this coloring for the digital image encoding.
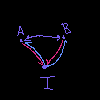
2-Dimension
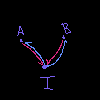
There are a number of 2-dimensional types, and it’s beyond the scope of this paper to outline them all. However, we’ll be focusing on two main ones: Cylinder and Square.
| Type | Shape | Diagram |
|---|---|---|
Cylinder(...) |
 |
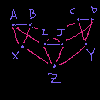 |
Square(...) |
 |
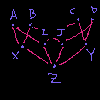 |
These diagrams are substantially more complex than the interval and loop diagrams, and so we omit the restriction maps in the diagrams. For completeness, the restriction maps are included in the later digital images – again, using the same coloring as above.
Diagrams to Digital Images
This section will explore the connection between complexes, diagrams, and digital images. We will present the objects in the same groupings as above.
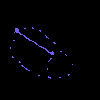
We encode the diagrams as digital images by representing the diagram as an adjacency matrix and subsequently viewing that matrix as an array of data defining an image. In all of the digital images, purple pixels represent an equality map; pink pixels represent an inclusion map; and blue pixels represent a restriction map.
0-Dimension
Here, we will represent each object three ways: as a shape, as the inclusion diagram, and as digital images of those diagrams.
| Shape | Diagram | Image |
|---|---|---|
|
|
 |
1-Dimension
We focus on the same two 1-dimension objects, Interval and Loop:
| Shape | Diagram | Image |
|---|---|---|
|
|
 |
|
|
 |
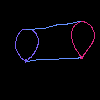
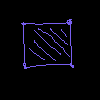
2-Dimension
We focus on the same two 2-dimension objects, Cylinder and Square:
| Shape | Diagram | Image |
|---|---|---|
|
|
 |
|
|
 |
Example: Cylinder = Square + Glue
We’re going to explorte an example in two directions: first, by translating a type statement into digital images to generate a computational result; and then, by translating that resulting digital image back into a type statement. This show show we can compute unknown types using the digital image encoding.
Many readers are familiar with the idea that a cylinder is a square glued along opposite sides, that is, we can say Cylinder = Square + Glue. And indeed, this formalizes as a statement within our type system. How then does this translate into the digital image encoding?
Translating the Relationship
We want to encode that Cylinder = Square + Glue, so we’ll need to discover some image such that “adding” it to the Square image gives us the Cylinder image. A reasonable way to do that is by examining the difference of the Cylinder and Square images. This will let us translate the “adding” relationship in the types to composition of images.
Taking the two images above, we compute the image for Glue as Cylinder - Square:
| Type | Cylinder |
- |
Square |
= |
Glue |
| Shape | |
|
??? |
||
| Diagram | |
|
??? |
||
| Image | |
|
 |
Okay, now that we have the appropriate image for Glue, how do we interpret those results within our model?
Interpreting the Glue Image
Now that we’ve constructed an object representing the Glue type, we want to understand what it means within our model.
To do that, we’ll invert the process above:
- start with the digital image;
- convert the digital image to a construction diagram;
- interpret that construction diagram as a decorated shape model;
- interpret that decorated shape model as a type statement.
We present those steps and explain them below:
| Image | Diagram | Shape | Type |
|---|---|---|---|
|
? |  |
Glue = Interval(Eq, Eq, Eq) |
We start just by repeating the digital image of the glue term.
We then interpret that image as an adjacency matrix and convert that into a graph/diagram representation in the second column. This shows something interesting: that we have a higher order structure of equivalence relationships (and in particular, bi-directional inclusions).
We then collapse that diagram into a decorated geometric model, in this case an Interval of equivalence relationships.
Which we can then interpret as a type statement that the Glue type is an Interval of equivalences between sides of the Square – which is what we wanted!
So we can see that transforms in the digital image model accurately represented the type relationships. This is generally the case, for appropriate transforms.
Conclusions
We explored in two parts how to translate types into digital images – first by transforming a type into a construction diagram and second by translating that construction diagram into a digital image.
We followed that with the example of a Cylinder being a Square combined with Glue along opposite edges – and saw how the process could be reversed, to understand the types arrived at by manipulating the model directly.
This representation is important – as digital images are amenable to fast computation and so provide an avengue towards accelerating mathematical reasoning.
Future Work
ZMGS Abstract is exploring effective semantics – exploring the type theories induced by treating datasets as semantic models.
This paper introduces those concepts in reverse: generating synthetic data structures (captured in the digital image) based on typed statements.
We will be continuing that in a number of future papers, building readers familiarity with the connection between digital images and typed statements by exploring increasing complicated types – groups and complexes.
We will then show how those “higher order” structures can be recovered from data – and ultimately, how to recover the internal language (type theory) from the effective semantics induced by phenomena (as measured in data).
We believed that this is a novel approach to creating qualitative interpretations of data – attaching type statements to datapoints, by introducing a sheaf on the dataset.
Appendix: Terminology
| Term | Source | Description |
|---|---|---|
| complex | https://en.wikipedia.org/wiki/CW_complex | An object built by gluing pieces of various dimension together. |
| diagram | https://en.wikipedia.org/wiki/Category_theory | A diagram representing relationships between objects, maps, and cells. |
| sheaf | https://en.wikipedia.org/wiki/Sheaf_(mathematics) | A decorated complex. |
Appendix: Summary Table of Mappings
We summarize the tables above for easy reference.
In all of the diagrams and digital images, purple represents an equality map; pink represents an inclusion map; and blue represents a restriction map.
| Type | Shape | Diagram | Image |
|---|---|---|---|
Point(a) |
|
|
|
Interval(a, b) |
|
|
|
Loop(a, b, a=b) |
|
|
|
Cylinder(...) |
|
|
|
Square(...) |
|
|
|
Glue(...) |
|
|
Appendix: Generating Digital Images from Models
To generate the digital images of diagrams, we used our MathEngine library to construct a semantic model diagram which is internally stored as an image. Included in the library is the tool we used to render these graphics from those models.
You can find the code to generate this paper here: https://github.com/spacepowermonkey/mathengine/blob/master/papers/shapes_as_digital_images.py
And the overview of our library here: https://github.com/spacepowermonkey/mathengine